One of the most important weapons in a Developer’s Arsenal is their Code Editor. It is where we write our code to talk to the Machines and make it do what we want. There are numerous code editors available in the market now but today I will discuss the one which is arguably the most famous of them all, the one and only VS Code by Microsoft.
One should know its tricks and shortcuts for a better coding experience and results. So today I will share with you proven tips & tricks in VS Code which you can use for effective Debugging while developing your software.

Setting up your debug environment is necessary before you can begin debugging with VS Code. You must first generate a launch configuration file in order to enable debugging for your programme in VS Code. VS Code supports a variety of debugging scenarios. This file details the debugging environment to utilise, the arguments to supply, and how to launch your application.
To create your launch.json file, click on “create a launch.json file” in the Run Start view.
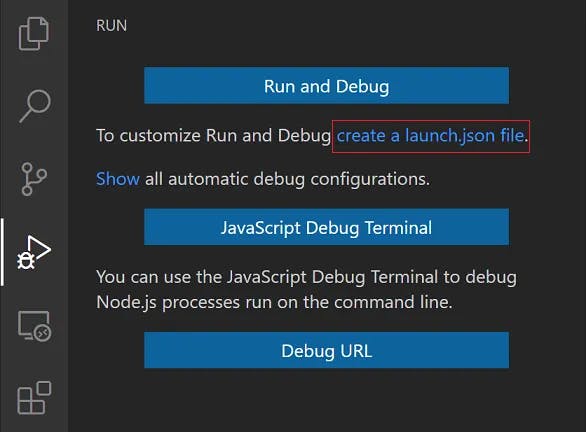
VS Code will try to automatically detect your debug environment, but if this fails, you will have to choose it manually. Choose the desired debug configuration symbol for your application from the drop-down list, click on the gear icon that appears to the right of the configuration list, and select ‘Add Configuration.’
This will create a new launch.json file in the .vscode directory of your workspace. This file is where you specify the debug configuration for your app. You can edit this file to add arguments, environment variables, and other settings that your app may require to launch successfully in debug mode.
Now that you have successfully set up your Debugging environment, let's learn some tips & tricks for effective debugging.
Conditional Breakpoints :
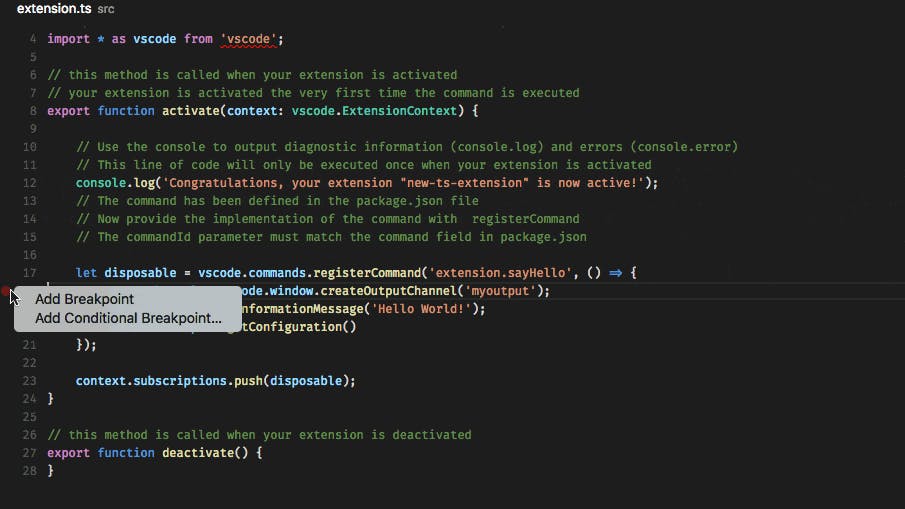
Whenever you create a breakpoint it stops at it every time, but sometimes you may need it to hit on a condition. Here comes to rescue conditional breakpoints, by right-clicking on a breakpoint and selecting ‘Edit Breakpoint’ you can add a condition to the breakpoint to stop only when the condition is true.
Debugging Multiple threads :
Although it can be a little challenging, Visual Studio Code can be used to debug multi-threaded applications. By including particular configuration options in your launch.json file, you must enable thread debugging. Setting breakpoints in your code and beginning debugging are both possible once thread debugging is enabled.
Visual Studio Code provides a “ Threads ” view in the Debug panel, which lists all threads of your application, and displays their current state and ID. You can switch between threads from this view or by using commands in the Debug Console. You can also debug multiple threads simultaneously by launching multiple debug sessions using different configurations.
While debugging multi-threaded code will take some expertise and perseverance, Visual Studio Code’s robust debugging facilities will make it possible for you to locate errors affecting several threads with relative ease.
Data Inspection when debugging :
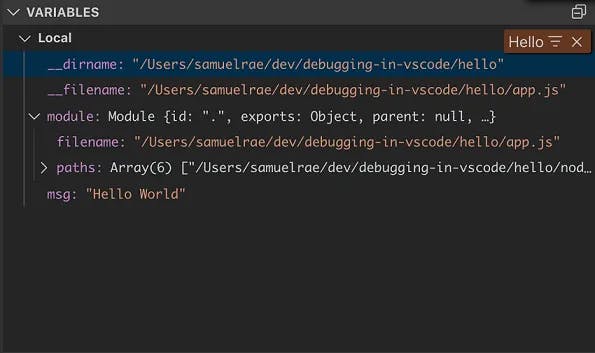
Data inspection is an essential aspect of debugging your program using Visual Studio Code. During the debugging process, you can inspect the values of variables and see how the code is behaving. Variables can be inspected in the VARIABLES section of the Run and Debug view or by hovering over their source in the editor. Variable values and expression evaluation are relative to the selected stack frame in the CALL STACK section.
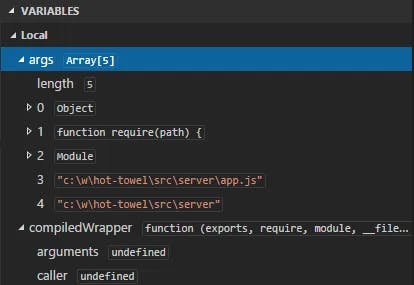
Variable values can be modified with the Set Value action from the variable’s context menu. Additionally, you can use the Copy Value action to copy the variable’s value or Copy as Expression action to copy an expression to access the variable.
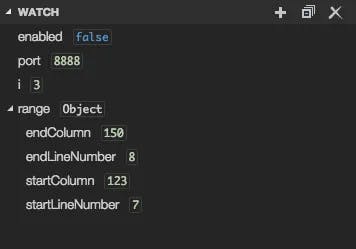
Variables and expressions can also be evaluated and watched in the Run and Debug view’s WATCH section.
Variable names and values can be filtered by typing while the focus is on the VARIABLES section.
Debug Console :
In some cases, you may want to print debug statements to the console while debugging. The ‘Debug Console panel in VS Code provides an interactive console where you can evaluate expressions, assign variables, and call functions.
As soon as a debugging session starts, the DEBUG CONSOLE panel is displayed and shows debugging output and the Status Bar changes colour (orange for default colour themes):
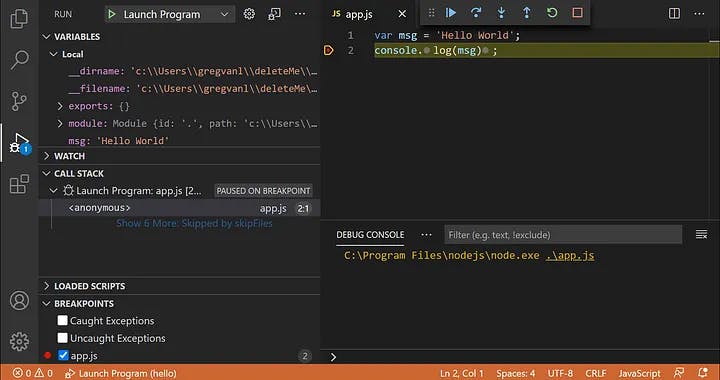
You can communicate with the Node.js runtime environment through the Debug Console as well. To access the Node.js APIs and objects while debugging a Node.js application, utilise the Debug Console. As a result, you can examine and alter the state of your Node.js application while debugging.
Overall the debug console is a super useful tool for you to interact with your code and runtime environment while debugging. It helps you to find issues efficiently.
Remote Debugging :
Remote debugging is the process of debugging an application that is running on a different machine than the one hosting the debugger. VS Code does not itself support remote debugging: this is a feature of the debug extension you are using, and you should consult the extension’s page in the Marketplace for support and details.
There is, however, one exception: the Node.js debugger included in VS Code supports remote debugging. See the Node.js Debugging topic to learn how to configure this.
So you see that Debugging is an iterative process and these tips will help you in doing so effectively. But the way you use these lies in your hands solely. Whether it is conditional breakpoints or remote debugging, VS Code has all the features that developers need to debug their code effectively its just that one should know it.
I have made this article from my own experience and by learning from many documents and articles, if there is any mistake comment below and if you have ideas to improve this article, reach out to me. If you found my blog interesting and want to hire me, email me at fa1319673@gmail.com
